Reports Overview
QueeCom provides a comprehensive dashboard with various key report cards and filter options to help you track your store’s performance at a glance.
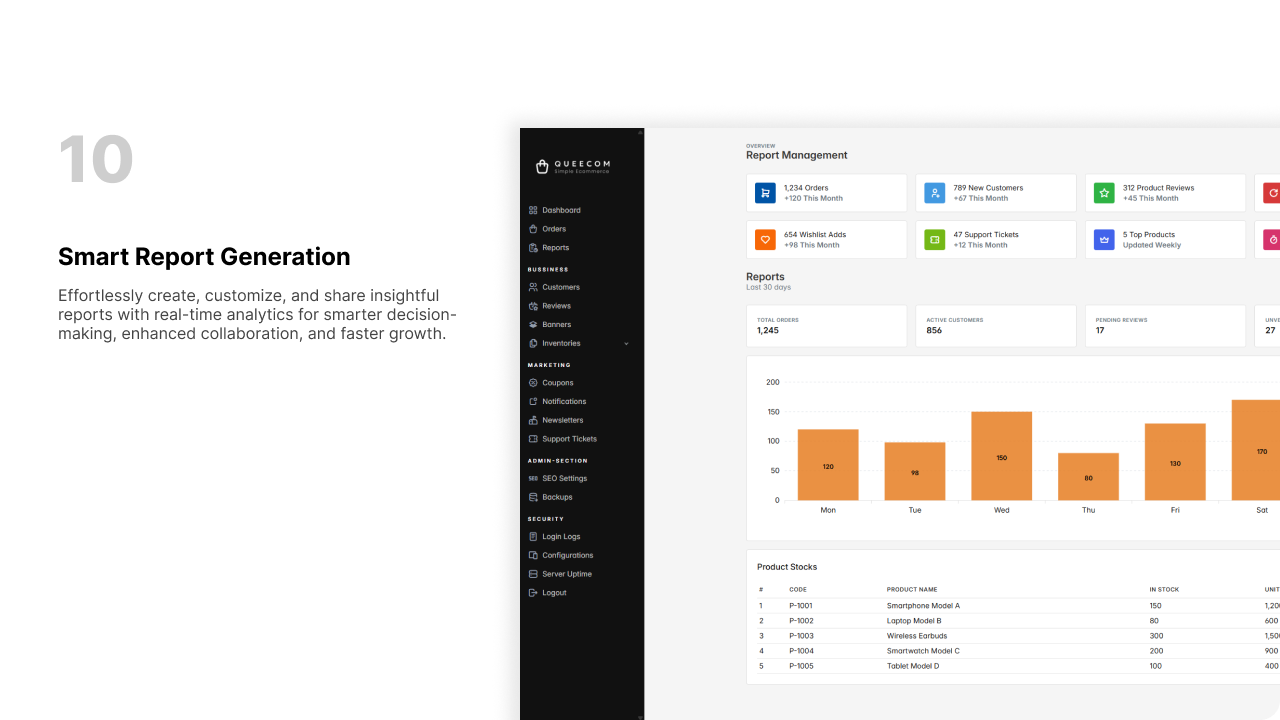
1. Available Report Cards
The dashboard displays the following vital metrics as individual cards:
- Total Customers: Number of all registered customers.
- Total Products: Total products available in your store.
- New Customers: Customers who registered recently within the selected period.
- Product Reviews: Number of product reviews submitted by customers.
- Wishlists: Total items added to customer wishlists.
- Ads: Overview of active and past advertisements.
- Support Tickets: Count of open and resolved customer support tickets.
- Active Customers: Customers who have made recent purchases or activity.
Each card gives a quick summary of critical business insights.
2. Using the Generate Button and Filters
To customize report data based on time period:
- Click the Generate button on the reports dashboard.
- A filter panel will appear with date options:
- Date Range: Select specific start and end dates.
- This Month: Automatically filters data for the current month.
- This Year: Filters data for the current calendar year.
-
This Week: Filters data for the current week (starting Sunday or Monday based on settings).
-
Choose or input your preferred filter and apply it.
- The report cards will refresh to show data relevant to the selected timeframe.
Best Practices
- Regularly review reports with different date filters to spot trends.
- Use report insights to make informed business decisions.
- Combine filters with other analytics tools for deeper insights.
⚡ Efficient reporting helps you optimize your store operations and customer engagement.